Building a Modern Observability Stack
In today's complex software ecosystems, understanding what's happening inside your applications isn't just nice to have—it's essential for survival. Gone are the days when simple monitoring dashboards showing CPU and memory usage were sufficient. Modern applications demand a sophisticated observability strategy that provides deep insights into performance, behavior, and user experience.
The Three Pillars of Observability: Beyond Basic Monitoring
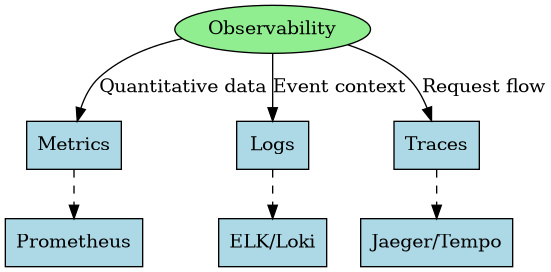
Observability transcends traditional monitoring by focusing on understanding the internal state of a system through its external outputs. This approach relies on three fundamental pillars:
Metrics: The Quantitative Foundation

Metrics provide the numerical data points that quantify system behavior and performance over time. They are:
- Time-series data: Measurements collected at regular intervals
- Highly aggregatable: Easy to combine and analyze at scale
- Resource-efficient: Low overhead compared to other telemetry types
- Ideal for alerting: Perfect for threshold-based notifications
Our client, a fintech platform processing over 500,000 transactions daily, used metrics to identify a gradual performance degradation that traditional monitoring missed. By tracking custom business metrics alongside system metrics, they detected a correlation between increasing transaction volume and degrading database performance weeks before it would have impacted customers.
Key Tools: Prometheus has become the de facto standard for metrics collection, offering a powerful query language (PromQL) and seamless integration with visualization tools like Grafana. For cloud-native environments, options like Amazon CloudWatch, Google Cloud Monitoring, and Azure Monitor provide integrated solutions.
Logs: The Narrative Context

Logs tell the story of what happened in your system, providing critical context through timestamped events. They offer:
- Rich contextual information: Detailed descriptions of events
- Debugging capabilities: Essential for troubleshooting issues
- Sequential event records: Chronological story of system behavior
- Structured data potential: Machine-parsable when properly formatted
When an e-commerce platform experienced intermittent payment failures, their logs revealed a pattern of timeout errors occurring specifically during peak traffic periods, but only for certain payment providers. This insight led them directly to a configuration issue in their connection pooling that wouldn't have been visible through metrics alone.
Key Tools: The ELK stack (Elasticsearch, Logstash, Kibana) remains popular for log management, but newer options like Grafana Loki offer a more cost-effective approach with tight Prometheus integration. For cloud environments, services like AWS CloudWatch Logs, Google Cloud Logging, and Azure Log Analytics provide managed solutions.
Distributed Tracing: Following the Request Journey

Traces track requests as they travel through distributed systems, revealing the entire journey across services. They provide:
- End-to-end visibility: Follow requests across service boundaries
- Performance insights: Identify exactly where time is spent
- Dependency mapping: Reveal how services interact
- Bottleneck identification: Pinpoint slowdowns in complex flows
A media streaming service struggled with occasional buffering issues despite ample infrastructure capacity. Distributed tracing revealed that specific content categories triggered a complex recommendation algorithm that occasionally blocked the streaming initialization. By redesigning this flow to run asynchronously, they eliminated the buffering issues entirely.
Key Tools: OpenTelemetry has emerged as the standard for instrumentation, with backends like Jaeger, Zipkin, and Tempo providing trace storage and visualization. Cloud providers offer services like AWS X-Ray, Google Cloud Trace, and Azure Application Insights.
The Real-World Implementation Challenge
While these concepts are powerful, implementing a comprehensive observability stack presents several challenges:
Challenge 1: Data Volume Management

As systems scale, telemetry data can grow exponentially, leading to:
- Storage costs: Retaining high-volume data becomes expensive
- Query performance: Large datasets slow down analysis
- Signal-to-noise ratio: Important signals get lost in the noise
Winning Strategy: Implement a tiered approach to data retention. A financial services firm we worked with reduced their observability costs by 67% by keeping high-cardinality metrics for 15 days, aggregated metrics for 6 months, and applying intelligent sampling to traces based on business impact.
Challenge 2: Effective Instrumentation

Generating quality telemetry data requires thoughtful instrumentation:
- Consistency: Ensuring uniform practices across teams
- Overhead management: Minimizing performance impact
- Meaningful data: Collecting useful rather than excessive data
Winning Strategy: Develop instrumentation libraries and standards shared across teams. A healthcare technology platform created a common instrumentation library that automatically captured key performance metrics, standardized logging, and added distributed tracing to any service that included it. This approach ensured consistent observability with minimal developer effort.
Challenge 3: Correlation Across Telemetry Types

The true power of observability comes from correlating across different types of telemetry data:
- Unified timestamps: Ensuring time alignment across systems
- Consistent identifiers: Tracking requests across telemetry types
- Integrated visualization: Seeing relationships in a single view
Winning Strategy: Implement correlation IDs that flow through all telemetry types. An e-commerce platform implemented trace IDs that appeared in logs, metrics, and traces, allowing engineers to seamlessly pivot between different views of the same user journey. This reduced their mean time to resolution (MTTR) by 78%.
Building Your Observability Stack: A Practical Roadmap
Based on our experience implementing observability solutions for organizations ranging from startups to enterprises, we've developed a phased approach:
Phase 1: Foundation (1-2 Months)
- Goal: Establish basic telemetry collection across all pillars
- Actions:
- Deploy centralized logging with basic structure and indexing
- Implement system-level metrics collection (CPU, memory, network)
- Add basic tracing to critical services
- Set up initial dashboards and alerts
Phase 2: Enrichment (2-3 Months)
- Goal: Enhance telemetry with business context
- Actions:
- Define and implement business metrics aligned with KPIs
- Enrich logs with structured context (user IDs, transaction IDs)
- Extend tracing coverage to all services
- Create integrated views correlating business and system performance
Phase 3: Intelligence (3+ Months)
- Goal: Move from reactive to proactive insights
- Actions:
- Implement anomaly detection on key metrics
- Create service-level objectives (SLOs) and error budgets
- Add user experience telemetry (real user monitoring)
- Develop predictive capacity planning capabilities

The Observability Tech Stack: Making the Right Choices
The observability landscape offers numerous options, from open-source tools to commercial platforms and cloud services. Here's our perspective on building a sustainable stack:
When evaluating tools, consider these factors:
- Operational Model: Do you prefer managing infrastructure (self-hosted) or consuming services (managed)?
- Integration Capability: How well does it integrate with your existing environment?
- Scalability Needs: Can it handle your data volume and query patterns?
- Cost Structure: Does the pricing align with your usage patterns?
- Team Expertise: Do you have the skills to effectively use and maintain it?
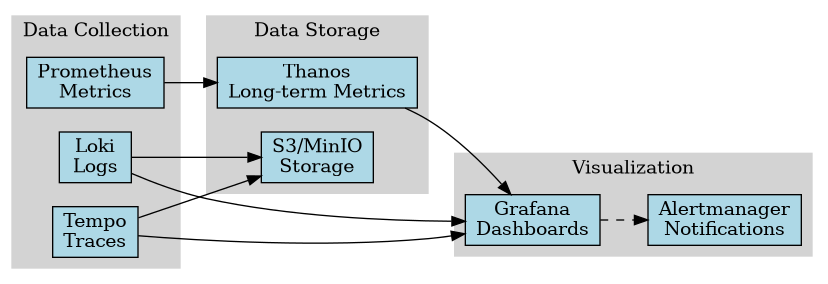
Our Recommended Stack for Most Organizations
Based on our implementation experience, this combination offers an excellent balance of capability, maintainability, and cost-effectiveness:

- Metrics: Prometheus for collection + Thanos for long-term storage
- Logging: Grafana Loki with structured logging
- Tracing: OpenTelemetry instrumentation with Tempo backend
- Visualization: Grafana dashboards providing unified views
- Alerting: AlertManager with well-defined alert routing and escalation
For organizations deeply invested in a specific cloud provider, the native observability services often provide good integration at competitive pricing.
Beyond Technology: The Observability Culture

The most sophisticated observability stack is only as effective as the organizational culture supporting it. Successful implementations require:
Shared Responsibility Model
Observability shouldn't be the sole domain of operations teams. Development teams need to:
- Own the instrumentation of their services
- Participate in defining what "good" looks like
- Be actively involved in troubleshooting production issues
A retail platform we worked with implemented "observability as code" where observability requirements were reviewed alongside feature code, ensuring comprehensive coverage before deployment.
Data-Driven Decision Making
Observability data should drive key decisions:
- Release decisions based on performance data
- Capacity planning informed by growth trends
- Feature prioritization influenced by user experience metrics
One SaaS provider we worked with created an "observability council" that regularly reviewed insights from their telemetry data and translated them into concrete action items for product and engineering teams.
Continuous Improvement Loop
Observability is never "done." Establish regular reviews to:
- Assess the effectiveness of current telemetry
- Identify visibility gaps in new features or services
- Refine alerting to minimize false positives and negatives
Measuring the ROI of Observability
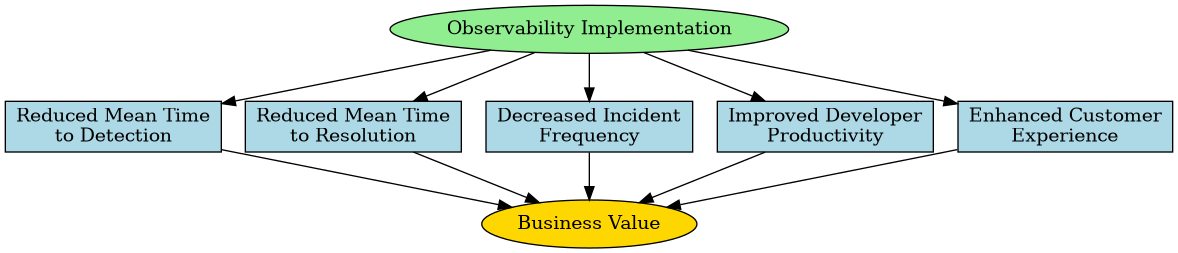
Investing in observability yields tangible business benefits that should be tracked:
- Reduced Mean Time to Detection (MTTD): How quickly can you identify issues?
- Reduced Mean Time to Resolution (MTTR): How fast can you fix problems?
- Decreased Incident Frequency: Are you experiencing fewer production issues?
- Improved Developer Productivity: How much time is saved in debugging?
- Enhanced Customer Experience: Has reliability improved from the user perspective?
A B2B platform documented a 62% reduction in MTTR and 45% decrease in incident frequency in the six months following their observability overhaul, translating to approximately 120 additional engineering hours per month redirected from firefighting to feature development.
The Future of Observability
As we look ahead, several trends are shaping the evolution of observability:
OpenTelemetry Convergence
The industry is rapidly standardizing on OpenTelemetry as the unified instrumentation framework across all telemetry types, simplifying implementation and ensuring interoperability.
AI-Powered Analytics
Machine learning is increasingly being applied to observability data to:
- Automatically detect anomalies before they become incidents
- Identify patterns and correlations humans might miss
- Suggest potential root causes during incidents
Continuous Verification
Observability is extending into the CI/CD pipeline through techniques like:
- Synthetic transactions in staging environments
- Canary deployments with automated rollback based on telemetry
- Performance regression testing integrated into delivery workflows
Conclusion: The Journey to Observable Systems
Building a modern observability stack is not a one-time project but a continuous journey. As your systems evolve, so too must your approach to understanding their behavior. The organizations that invest in comprehensive observability gain not just operational insights but strategic advantages: faster innovation, higher reliability, and better user experiences.
The path to observability maturity may seem daunting, but each step delivers value. Start with the foundations, evolve incrementally, and maintain a relentless focus on answering the critical questions about your systems. The insights you gain will transform not just how you operate but how you build software.
In a world where digital experiences are business-critical, observability isn't optional—it's essential for survival and success.